
West Suffolk's average fell £1,593 on the year to August, the first annual fall since December. Flats are down 3.4% and spring sales were the lowest since 2009.
The average West Suffolk home was worth £295,860 in August. A year earlier it was £297,453. That is a fall of £1,593, or 0.5%, over twelve months.
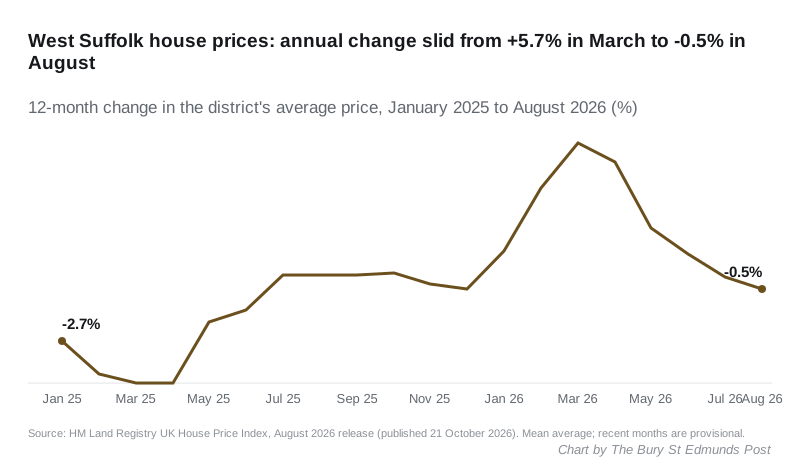
It is the district’s first annual fall since December 2025. In March, prices were rising at 5.7% a year. The rate has dropped every month since.
The figures are from HM Land Registry’s UK House Price Index for August 2026, published on Wednesday 21 October.
There is one small piece of better news. August’s average was 0.6% higher than July’s, the first monthly rise since April. One month does not make a turn, and the annual figure is the more reliable guide.
UKHPI reports a mean average, not a median. The district’s expensive detached houses pull it up, so it does not describe a typical sale. It is best read for the direction of travel.
How the annual rate came down
- March 2026: +5.7%
- April: +4.9%
- May: +2.1%
- June: +1.0%
- July: 0.0%
- August 2026: -0.5%
What is rising and what is falling
| Property type | August 2026 average | Change on the year |
|---|---|---|
| Detached | £449,670 | -0.8% |
| Semi-detached | £280,776 | +0.1% |
| Terraced | £231,512 | +0.2% |
| Flat or maisonette | £145,376 | -3.4% |
| First-time buyer | £246,508 | -0.2% |
Flats are still the weakest part of the market. The average West Suffolk flat is now £15,941 below its November 2022 level of £161,317, a fall of 9.9%.
Detached houses have joined the fallers this month, down 0.8%. Terraced and semi-detached homes are roughly where they were a year ago.
Buyers using a mortgage paid an average of £294,047, down 0.4%. Cash buyers paid £300,611, down 0.8%.
How few homes are selling
Sales counts run two months behind prices. They show the same slowdown.
930 homes sold in West Suffolk between January and June 2026, on the Land Registry’s current count. That is the lowest first half of any year since 2009, when 906 sold.
For comparison, the first half of 2024 recorded 1,063 sales and 2023 recorded 1,086. The recent months are provisional and are usually revised up a little as registrations arrive. Even so, the gap is wide.
How West Suffolk compares with its neighbours
West Suffolk ranked 213th of 295 English districts for annual change in August. It was one of 107 districts where the average fell.
| Area | August 2026 average | Change on the year |
|---|---|---|
| Mid Suffolk | £317,979 | +5.3% |
| Ipswich | £226,175 | +2.4% |
| East Cambridgeshire | £340,059 | +2.0% |
| Braintree | £330,089 | +1.6% |
| Babergh | £331,207 | +0.9% |
| South Cambridgeshire | £441,410 | +0.2% |
| Breckland | £266,835 | -0.3% |
| West Suffolk | £295,860 | -0.5% |
| East Suffolk | £277,949 | -2.3% |
| Suffolk county | £282,759 | +0.4% |
| England | £293,525 | +0.4% |
Mid Suffolk, which borders the district to the east, is rising more than ten times as fast as the England average. West Suffolk is falling while England, the East of England (+0.2%) and Suffolk as a whole are all slightly up.
The earlier figures have been revised down
Each release revises the two or three months before it. This time every recent West Suffolk month came down:
- July: first published at £294,810 (+0.3%), now £294,197 (0.0%)
- June: £296,253 last month, now £294,874
- April, the spring high: first published at £300,268, now £299,957
That matters if you are pricing a sale against a figure you read in the summer. The spring peak was lower than first reported, and July was flat rather than rising.
What it means for you
- If you are selling, the district average is down on the year and £15,766 below its November 2022 peak of £311,626. An asking price set against the spring headlines is likely to look high.
- If you own a flat, values are down 3.4% on the year and nearly 10% on 2022.
- If you are a first-time buyer, the average first-time buyer price of £246,508 is slightly lower than a year ago, though fewer homes are changing hands.
- If you are watching for a turn, August’s 0.6% monthly rise is the thing to check against next month’s release.
Our running page on Bury St Edmunds house prices has the postcode picture, and we publish this district summary every month. Last month’s report is here. For the yearly cost of a home once you own it, see Bury St Edmunds council tax bands.
Sources
All figures are from HM Land Registry’s UK House Price Index, August 2026 release, published 21 October 2026: the West Suffolk district series and the full UK HPI data file, which carries every district and every month back to 1995. The ranking, the first-half sales totals and the comparison with earlier releases were calculated by The Bury St Edmunds Post from that file and from our own July report.
Have your say